I am presenting at the BCAMT Fall Conference this year about the new Computing Science Elective courses being offered in grade 11 & 12. Here are the slides I am using:
BCAMT 2017 Fall Conference
Reply

I am presenting at the BCAMT Fall Conference this year about the new Computing Science Elective courses being offered in grade 11 & 12. Here are the slides I am using:
I will be hosting 2 workshops at the STA Convention this year. Here are the materials I am presenting:
Project Based Learning in Computer Science and Programming
Computer Programming is not a Math Credit
Today we concluded our unit on sorting algorithms in Computing Science 12. I was very impressed by the work the class did to prepare. Students were responsible to research 2 O(n^2) and 2 O(nlgn) sorting algorithms and 1 wildcard that could be anything they like. The wildcard sort would be with integers so students could learn about sorting algorithms that are not comparison based (Radix, Bucket, Counting, etc.), if they wanted to (not a requirement). You can read more about it here.
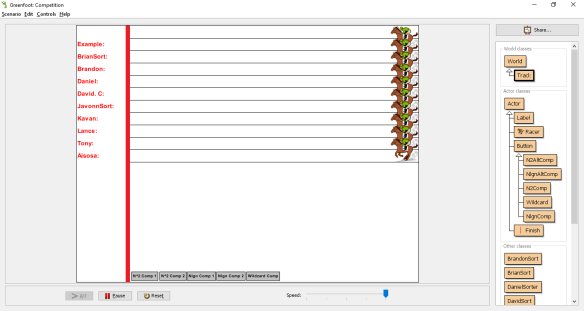
Students have to implement an interface (download it here) to “plug” into the competition. I built a skeleton project that looks a little cheesy but you can see visually who’s winning as each round completes. I’m not promising it’s perfect, but it added the dramatic effect that had everyone staying in a lunch to watch the results.
Get your copy here (a Greenfoot project).
You’ll probably do your own tinkering but here’s a few hints about how to setup the competition:
There are two variables to control the size of the test data generated. Depending on the speed of your computer and number of competitors you will probably want to adjust these.
To add your students to the competition they must load their classes into the project and add a new Object from their class to the loadCompetitors() method.
When you compile the project it will start running immediately. Click on the button at the bottom to determine which algorithm will run during the competition. Then hit the usual Greenfoot “play” button and watch the competition unfold. Once the competition is finished just click the button to indicate what the next one will be and you’re ready to go again.
Points are by placement. In a race with 10 competitors, 1st place gets 10 points, 2nd gets 9, 3rd gets 8, … In the event of a time, everyone in the tie gets the lowest amount of that group. For example if three people finished 2nd the points would be 10 for 1st, 7 for 2nd, 7 for 3rd, 7 for 4th, and 6 for fifth, … The competition checks to see if data is sorted properly (it can be either ascending or descending). When a student’s algorithm did not sort the data they are assigned a time of Integer.MAX_VALUE to place them in last.
If you’re looking for the materials I used to present at the first annual UBC Teacher Candidate mini conference here they are:
What’s so Important About Coding?
Computing Related Courses in BC’s Education Plan

I will be presenting at CUEBC 2016 on Friday. Here are the materials from the two workshops:
Computing and Programming in the new BC Ed Plan
Project Based Learning in Computing Science
This was a fun lab involving ratios that we did over the last couple of classes.
I guess I got tired of reading about paint mixture problems in textbooks and decided this would be a lot more fun (and it was). The supplies list is attached in the word document above, but it cost less than $10 and most of it can be reused by our math department.
What I liked about mixing the colors was students get to see how ratios maintain a proportion (otherwise the color does not match). Normally you’d have a question like:
Students that lack understanding will typically come up with 14L (add 9L to both Red and Blue). It just doesn’t have the same punch when you try to explain as when they see it first hand.
Students at work:

The “target” colors students were comparing their mixes against:

Success (one of the matches)!
I feel like some feedback on the lab itself might help improve it (reducing the number of questions in the tables or omitting them altogether). If you try it let me know how it goes.

Equivalence is one of the big ideas in Mathematics. In grade 8 we work with fractions, decimals, percentages, and ratios. Basically we work with numbers a lot. Unfortunately students tend to think of these representations as being different rather than equivalent because they are taught in separate sections of a textbook and likely different units during the school year. In fact, they may never revisit the topic again once taught.
This year I have been working with the idea of equivalence since September with the hope that students will develop better number sense and become familiar with equivalence as it becomes more abstract later on (ex. convert 3x2+6x+5 to vertex form).
We looked at percentage of a number recently and students could find their own strategies for dealing with simple cases like:
Where they started to generalize percentages as a proportion was when I posed the questions like this:
And asked if they could change the context to something other than percentages. Most made the connection between 50% and 1/2 and then could see that 25% was 1/4 (or 25/100) and that asking for the percent of a number was equivalent to asking for the portion of a number.
The beautiful part about this was I never prompted them to multiply by the percent and divide by 100. They made their own sense of the concept and were able to apply it.
One activity I did recently with equivalence and percentages looked like this: Grouping numbers. There was a lot of excellent conversations about how the numbers were related. Give it a try!
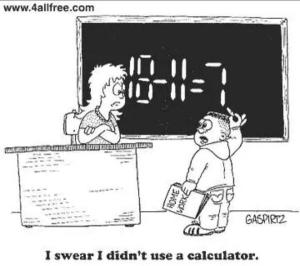
In my undergrad I remember one of my professors stating that “real mathematicians use a computer to do algebra”. The context of the statement was during very tedious algebraic work on a Calculus problem, which he made a mistake. None of us would argue that his careless mistake made him any less brilliant but rather it illustrates the fact that if the computer could do it for him faster and with greater accuracy why wouldn’t you use one? The computer can’t think through the problem solving process for you (although it can solve problems) but it certainly can make the process more efficient and allow problem solving that otherwise wouldn’t be possible/feasible by hand.
I did a Google search for: “ios app solve math equations step by step” while writing this. The top two hits were:
I’m sure quite a few teachers are frustrated by these apps, some might even be concerned about their job security (possibly also when they look at Khan Academy). Recently there was a discussion on the BC Association of Mathematics Teachers (BCAMT) email list around students using Wolfram Alpha to solve problems for them. Regardless of your position, access to and answers for the content we used to teach is now widely available. So what becomes of a mathematics education then?
This is all the buzz at the moment but also the reason there is a push to stop focusing on content and start developing skills that make successful mathematicians. If you haven’t thought about mathematics beyond the content you practiced with (solving equations, graphing functions, Calculus, etc.) I highly recommend you read about the Mathematical Habits of Mind.
As we reflect on how mathematics education is changing I think your position on calculator usage reflects where you are in that process. Do you see calculators as a tool to empower students or help them avoid learning mathematics? If you have the time, Conrad Wolfram (yes, the same as Wolfram Alpha) gave a TED talk about this:
 Reasoning is one of the skills that makes studying mathematics worthwhile. Lots of problems aren’t grounded in any particularly useful context but all of them can involve reasoning… if you plan for it.
That’s a pretty big if. Reasoning generally involves resolving some kind of conflict so if teach my students to master a formula or procedure, then I’m likely to reduce the chances of good reasoning skills being used.
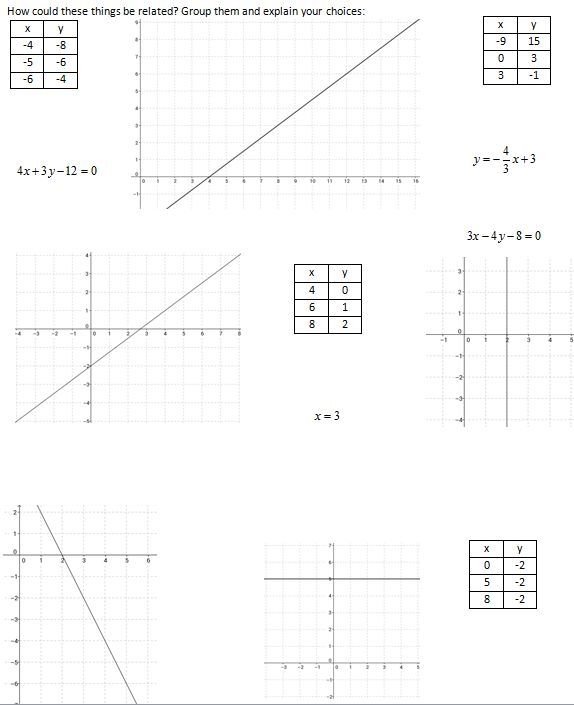
As the Math 10 provincial approaches, lines are a part of the exam that we discussed in the math department. So, even though I’m not teaching grade 10 now, I decided to try and put together some questions to encourage discussion. You can find them here if you are interested.
There are two goals in that assignment. I want students to communicate their work with each other and to link together different 4 representations of the same concept (linear relations) to help them develop it further:
In the first question there are many lines that can cover the points so students can discuss whether or not they have met the goal without necessarily having the same answer. They may also be skeptical of another student’s answer and start an argument to figure out if the different answer is still correct. They can also try to find out how few lines are needed to cover the points by being more strategic.

The second question puts all 4 representations together and asks students to group them. I used lines that share properties (that I hope they discuss) among their:
Finally, I like the activity book called “Get it Together”. It’s a pretty simple teaching strategy to get students talking about math. The first example is more typical, while the second is challenging.
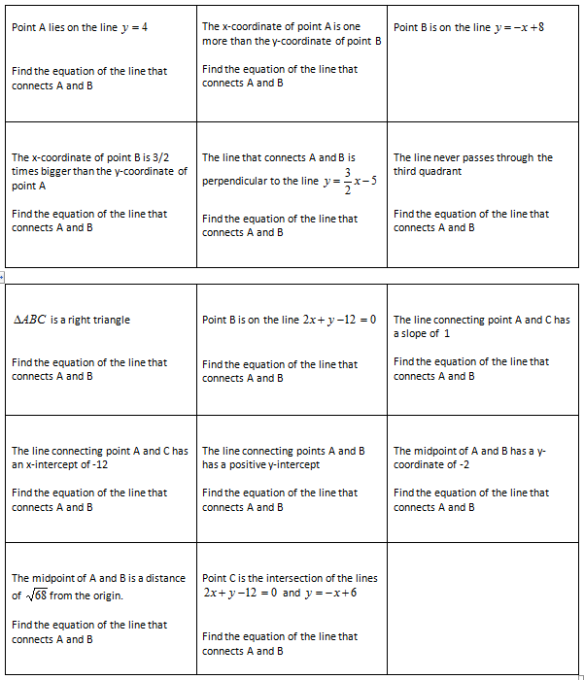
Hope you like the idea(s)!
 I’m teaching scale factors right now and I find it very illustrative of the problems that happen when students are learning mathematics as a set of procedures. It goes like this: I have a car that is 400cm long. I make a model using a scale factor of 1/10. How big is the model. Most students will reach for the mechanical answer, 400 * 1/10 = 40cm.
Now I ask, how big is the original if the model car I have is 40cm long and the scale factor is 1/10? Many will tell me 40 * 1/10 = 4cm. Strange, even if they didn’t understand how scale factors work I would hope that they would recognize that 4cm is not a reasonable size of a real car. I also see the lack of understanding when I say I have a model car that is 40cm long and the real car is 400cm, what’s the scale factor? Some will say 1/10 (40/400), others 10 (400/40).
I attribute this to the need for an answer vs. the desire to develop a concept. It feels a lot easier if all I do is explain “the rules” and try to keep things simple to get an answer (I used to pride myself on that ability). If I say multiply the scale factor by the original size to get the model, you will get an answer but you haven’t spent any time understanding how that process works. The side effect is that students will associate multiplication with scale factors and use it in other situations where they shouldn’t. Now things feel really complicated because they don’t understand what they are doing. The simple approach (one that tries to simplify concepts into procedures) is really the one that makes people think math is complicated.
I like questions like this better:
Match the item with its scale factor. How big is the actual item if you use your scale factor? Do your choices make sense?
| A picture of a virus is 10cm in a textbook | 100000000:1 |
| A Statue of Liberty souvenir is 9.3cm | 0.001 |
| A formula one race car toy is 23cm long | 5% |
| The world’s largest hockey stick is 205ft long | 1% |
| An F16 fighter jet model is 15cm | 5000 |
| A diagram of an animal cell is 10cm | 40:1 |
There are lots of entry points here, and the answers are given. I feel like that helps take the focus away from getting the answer and moves to thinking about how the answer was obtained. Someone struggling can give me a response like “The fighter jet is smaller than a real fighter jet so you must have used a small scale factor. I picked 0.001”. That makes the real jet 150m long but still tells me they understand something about how a scale factor is applied. The values were chosen strategically so that if one takes the wrong scale factor, it will effect another choice. Even if they think 150m is reasonable for the F16, that makes means the Statue of Liberty is either 9.3m or 1.86m and would tip off a student that they need to reconsider their choices. I also followed up with a similar set of figures and scale factors:
Choose an appropriate scale factor for each item. How big is the reproduction if you use your scale factor? Do your choices make sense?
| Eiffel tower (301m) | 1000% |
| Pharaoh ant (2mm) | 1:200 |
| CPU (2cm) | 1:500 |
| Lake Superior (560km) | 0.000001 |
| Boeing 747 Jumbo Jet (71m) | 3000 |
| Pollen (0.005cm) | 150 |
Here I’m still looking for communication of understanding. I hope students could reason out appropriate choices and demonstrate their understanding of scale factors. “The Eiffel tower is very large and needs to be shrunk so I am looking for a scale factor less than 1. If I use 0.000001 then the model would be 0.000301m tall which isn’t reasonable so I think it will be either 1:200 = 1/200 = 0.005 or 1:500 = 1/500 = 0.002…”.
As we are also developing number sense, we are practicing different forms of representing a quantity: fraction, decimal, percent, ratio, etc. I don’t like that most textbooks treat these as different units, isolating them from one another. I’d rather my students use what they feel is most convenient and they won’t unless they are used to working with numbers represented in different ways. It also turns the lesson from “you need to know about percentages because you need to know about percentages (have a unit test, etc.)” to students asking “How do I work with percentages to solve this problem?” (intrinsic motivation).
